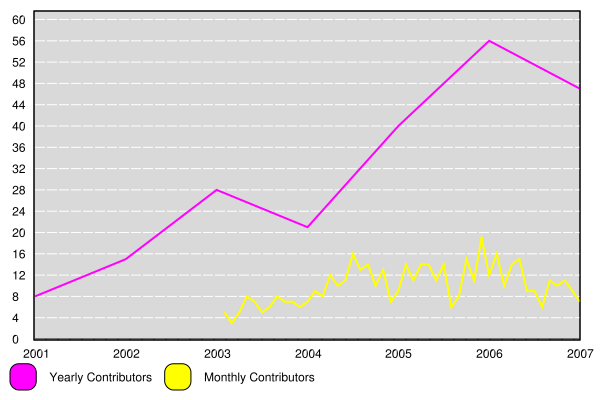
I took a break from the day-to-day work (maybe giving Visual Studio’s a timeout will solve it’s “Generation of designer file failed: Unknown server tag…” problem), and noticed jsnell posted a list of SBCL contributors to #lisp, and decided to do some graphing:

Of course, since I’ve never graphed this before, I found 2 bugs. I copied the text from jsnell paste and used cl-ppcre to split it up into data sets. I had to do a little math to get the months to line up nicely with the yearly sums, but it was all pretty straightforward.
Code, excluding the copied text from lisppaste:
(defun make-months ()
  (loop for month in '("Jan" "Feb" "Mar" "Apr" "May" "Jun"
		       "Jul" "Aug" "Sep" "Oct" "Nov" "Dec")
	counting T into val
	collect (list month (float (/ val 12)))))

(defun yearly-data ()
  (let (result)
	(cl-ppcre:do-register-groups (year contribs)
	    ("(\\d+):(\\d+)" +yearly-raw-data+)
	  ;;add 1 so the yearly totals line up with
	  ;;december monthly data
	  (push (list (+ 1 (parse-integer year))
		      (parse-integer contribs))
		result))
	result))

(defun monthly-data ()
  (let ((months (make-months))
	result)
	(cl-ppcre:do-register-groups (year monthname contribs)
	    ("(\\d+)-(\\w{3}):(\\d+)" +monthly-raw-data+)
	  (push (list
		 (+ (parse-integer year)
		    (second
		     (assoc monthname months
			    :test #'string=)))
		 (parse-integer contribs))
		result))
	result))

(defun yearly-graph ()
  (with-line-chart (600 400)
    (add-series "Yearly Contributors" (yearly-data))
    (add-series "Monthly Contributors" (monthly-data))
    ;;so the yearly totals line up, the data is offset by 1
    (set-axis :x nil :draw-gridlines-p nil :data-interval 1
	      :label-formatter #'(lambda (y)
				   (princ-to-string (1- y))))
    (set-axis :y nil)
    (save-file "yearly.png")))
5 Comments