sbcl contributors over time
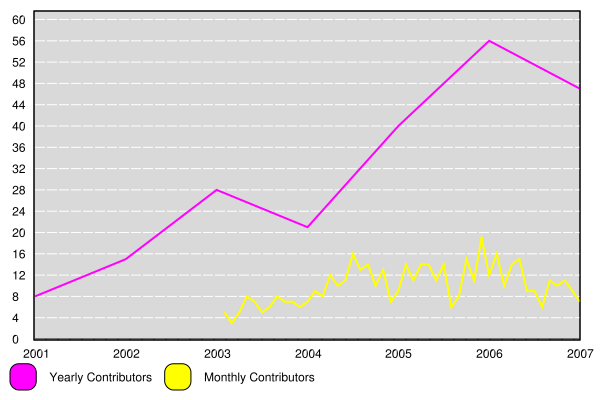
I took a break from the day-to-day work (maybe giving Visual Studio’s a timeout will solve it’s “Generation of designer file failed: Unknown server tag…” problem), and noticed jsnell posted a list of SBCL contributors to #lisp, and decided to do some graphing:

Of course, since I’ve never graphed this before, I found 2 bugs. I copied the text from jsnell paste and used cl-ppcre to split it up into data sets. I had to do a little math to get the months to line up nicely with the yearly sums, but it was all pretty straightforward.
Code, excluding the copied text from lisppaste:
(defun make-months ()
(loop for month in '("Jan" "Feb" "Mar" "Apr" "May" "Jun"
"Jul" "Aug" "Sep" "Oct" "Nov" "Dec")
counting T into val
collect (list month (float (/ val 12)))))
(defun yearly-data ()
(let (result)
(cl-ppcre:do-register-groups (year contribs)
("(\\d+):(\\d+)" +yearly-raw-data+)
;;add 1 so the yearly totals line up with
;;december monthly data
(push (list (+ 1 (parse-integer year))
(parse-integer contribs))
result))
result))
(defun monthly-data ()
(let ((months (make-months))
result)
(cl-ppcre:do-register-groups (year monthname contribs)
("(\\d+)-(\\w{3}):(\\d+)" +monthly-raw-data+)
(push (list
(+ (parse-integer year)
(second
(assoc monthname months
:test #'string=)))
(parse-integer contribs))
result))
result))
(defun yearly-graph ()
(with-line-chart (600 400)
(add-series "Yearly Contributors" (yearly-data))
(add-series "Monthly Contributors" (monthly-data))
;;so the yearly totals line up, the data is offset by 1
(set-axis :x nil :draw-gridlines-p nil :data-interval 1
:label-formatter #'(lambda (y)
(princ-to-string (1- y))))
(set-axis :y nil)
(save-file "yearly.png")))
Rahul Jain said,
February 6, 2008 @ 12:33 pm
(defparameter *months* ‘(”Jan” “Feb” “Mar” “Apr” “May” “Jun” “Jul” “Aug” “Sep” “Oct” “Nov” “Dec”))
(defun yearly-data ()
(loop for entry in +yearly-raw-data+
for year = (parse-integer entry :end 4)
for contribs = (parse-integer entry :start 5)
collect (list year contribs)))
(defun monthly-data ()
(loop for entry in +monthly-raw-data+
for (year year-end) = (parse-integer entry :end 4)
for month = (position entry *months* :test (lambda (x y) (string= x y :start1 5 :end1 8))
for contribs = (parse-integer entry :start 9)
collect (list (+ year (/ month 12)) contribs)
(defun yearly-graph ()
(with-line-chart (600 400)
(add-series “Yearly Contributors” (yearly-data))
(add-series “Monthly Contributors” (monthly-data))
;;so the yearly totals line up, the data is offset by 1
(set-axis :x nil :draw-gridlines-p nil :data-interval 1
:label-formatter #’(lambda (y)
(princ-to-string (1- y))))
(set-axis :y nil)
(save-file “yearly.png”)))
Haven’t tried the code, or even seen if it parses, so caveat emptor.
Juho Snellman said,
February 6, 2008 @ 1:03 pm
Just to clarify, those results are produced by a very stupid perl script groveling over the CVS logs, mainly for the purpose of having some number available when doing a presentation/paper/survey on sbcl. So I wouldn’t read too much into the numbers.
Christophe Rhodes said,
February 6, 2008 @ 1:09 pm
For a clearer graph, I would suggest plotting the two lines on different scales, so that the monthly-contributors curve has a vertical scale 12 times as big as the yearly-contributors.
This would allow a reader of your graph to infer at a glance what proportion of contributors are one-off and what proportion are repeat, by seeing how much of the monthly curve is above the yearly one.
John Wiseman said,
February 7, 2008 @ 5:56 pm
Along similar lines see http://lemonodor.com/archives/2005/08/source_code_res.html
Antonio said,
February 23, 2008 @ 8:40 am
Yellow on grey? What about making a white background and grey dashed lines? Much more legible, I think