Gonna try to be quick about this, as there’s chicken on the grill. I took a break from Team Fortress 2 to play some more with Vecto, another fine library from Xach. I started another post about last weekend’s lisp playing, but this one got finished first.
I’ve been tracking my fuel efficiency for a few weeks, noting the date, gallons purchased, price per gallon, and miles since last refill. You can’t control what you don’t measure. I had a ruby script keeping up with these as YAML and then giving me some handy stats, but I’m trying to gain some levels in lisp, so I decided to fire up slime and make some graphs.
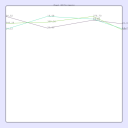
The graph isn’t pretty, but here’s my miles per gallon:
As usual, I pulled up my favorite lisp tutorial and #lisp, and after a few hours, I had a graph. Given my logging fetish, I imagine I’ll be growing the graphing capabilities in the future.
Right now, the implementation is a little weird. I have an class for a fuel entry, and then convert the date to a universal-time using net.telent.date. Then in my graphing function I use the universal time for the x values, and any number of functions for the y values (defaulting to #’mpg-of). In order to get the graph to take up most of the canvas, I then normalize the x and y values, so the minimum is 0 and the maximum is 1, and then scale the number to fit the canvas size before drawing.
I still consider myself a lisp beginner, and there are some bits I’m sure could be more efficient, but it works for now. Those interested in the code can get it here: fuelman.tar.gz, and any feedback in comments is much appreciated.
Update: Played with it a lot more, simplified my normalization crap a lot using loop instead of mapcar, and pulled it into a couple of objects: graph, graph-series, and fuel-graph-series. Also linked the source above as a proper .tar.gz file, after reading how to do that in wordpress. The aesthetics are still terrible, but it’s getting there:

