Some more progress on the charting library today:
- cleaned up the API a little bit, opting for some nicer make-foo function instead of requiring calls to make-instance:
- make-series label data
&keycolor - make-axis label
&keycontrol-string draw-gridlines-p label-formatter- control-string: a format-compatible control string, and supplying it sets the label-formatter for the axis
- label-formatter: a function of 1 argument, returns a string used as an axis label
- make-line-chart width height
&keyseries y-axis x-axis background
- make-series label data
- The lightened portion of the graph is now the average of the background color and pure white
- The labels on the axes are optional, and the graph adjusts to fill as big an area as possible
- The distance between x-axis labes is calculated based on actual string-widths, so hopefully they will space themselves out reasonably under most conditions
Some examples:
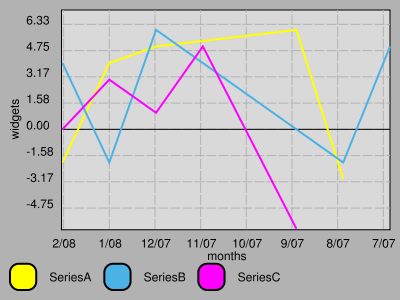
This demonstrates using a control-string and a custom function for axis labels:
  (render-chart
   (make-line-chart 400 300
		    :background '(.7 .7 .7)
		    :series (list (make-series "SeriesA"
					       '((-1 -2) (0 4) (1 5) (4 6) (5 -3)))
				  (make-series "SeriesB"
					       '((-1 4) (0 -2) (1 6) (5 -2) (6 5))
					       :color '(.3 .7 .9))
				  (make-series "SeriesC"
					       '((-1 0) (0 3) (1 1) (2 5) (4 -6))))
		    :y-axis (make-axis "widgets"
				       :control-string "~$")
		    :x-axis (make-axis "time"
				       :label-formatter #'months-from-now->mm/yy))
   "line-chart-with-axis-labels.png")
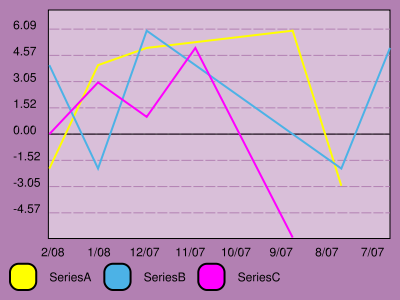
This one changes the background color, removes the axis labels, and disabled grid lines for the x-axis:
(render-chart
   (make-line-chart 400 300
		    :background '(.7 .5 .7)
		    :series (list (make-series "SeriesA"
					       '((-1 -2) (0 4) (1 5) (4 6) (5 -3)))
				  (make-series "SeriesB"
					       '((-1 4) (0 -2) (1 6) (5 -2) (6 5))
					       :color '(.3 .7 .9))
				  (make-series "SeriesC"
					       '((-1 0) (0 3) (1 1) (2 5) (4 -6))))
		    :y-axis (make-axis nil
				       :control-string "~$")
		    :x-axis (make-axis nil
				       :draw-gridlines-p nil
				       :label-formatter #'months-from-now->mm/yy))
   "line-chart-with-axis-labels.png")
The internals are still messy, but I’ve gone through and was able to simplify some things here and there, here’s a few of the change’s I’ve made to make my code shorter and more readable:
- replacing (destructuring-bind (x y) (foo) (bar x y) with (apply #’bar (foo))
- adding a macrolet to concentrate some very similar behavior
- using loop to count up and down at the same time (for drawing labels up/down the y axis and left/right on the x axis)
- using (dolist (item lst) …) instead of (mapc #'(lambda(item) …) lst)
- using loop‘s maximizing / minimizing features
- using multiple-value-list and nth to get specific values from some function results without compiler warnings
I’ve been trying to put my tongue on why exactly I like lisp so much more than other languages, and working through this made it pretty clear: I have much better tools for reducing accidental complexity than in other languages, and can get the code focusing on what I’m trying to do, not how my compiler needs me to do it. The next time I get a free afternoon, I’m going to make an imperative API, similar to vecto’s:
(with-line-chart (400 300 :background '(.7 .7 .7))
    (add-series "SeriesA"
		'((-1 -2) (0 4) (1 5) (4 6) (5 -3)))
    (add-series "SeriesB"
		'((-1 4) (0 -2) (1 6) (5 -2) (6 5))
		:color '(.3 .7 .9))
    (add-series "SeriesC"
		'((-1 0) (0 3) (1 1) (2 5) (4 -6)))
    (set-axis :y "widgets" :control-string "~$")
    (set-axis :x "time" :label-formatter #'months-from-now->mm/yy)
    (save-file "line-chart-with-axis-labels.png")
That’s pretty damn readable.
updated: fixed syntax error in the imperative sample, and got the imperative bit actually working.

