Spent a ton of time today playing with adw-charting. I wanted to expand on the source contributor graphs from the other day, and ended up implementing some basic bar chart functionality.
I’ve read a lot of complaints about the lack of lisp libraries, so whenever I sit down to do some random task, I try to use libraries as much as I can to test the validity of those complaints. I also learn a lot by reading and experimenting with other people’s code, and slowly I can see my style getting more lispish, and less C#-ish. clbuild makes it trivial to get many libraries usable, and today I had good luck with everything just working.
I used darcs as my source of dataset, its xml changes output has a simply formatted time string. I told clbuild to install closure xml (cxml), and in fairly short order I had a 80 line program that:
- uses the cxml klacks system to pull the information I wanted out of the file in one pass
- uses cl-ppcre to parse the username out of the darcs author string, so authors “Ryan Davis <ryan@acc…” and “ryan@acce…” both get displayed as “ryan”.
- uses adw-charting to chart patches per day into a png
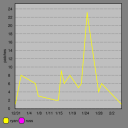
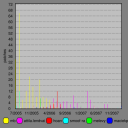
The result was less than spectacular:
The chart looks pretty nice, but its lying horribly. My data set didn’t have explicit zeros for days without activity, so the line goes from one active day to another, telling all kinds of lies. My favorite is the 2.5 patches it says I pushed on 1/11. The other fun one is that Russ shows up in the legend, but his one patch isn’t visible at all, because there was only one data point, and you need two points to make a line.
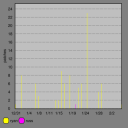
What is really appropriate here is a bar chart. Adding explicit zeros is a waste of time and RAM (among other things), so I opted for making a bar chart type. After many more hours of coding, I changed with-line-chart to with-bar-chart and re-ran my program:
Much better. There’s a few rendering problems, but the data is shown alright.
Adding support for bar charts was actually really easy, it was going back and reworking my amatuerish code that took most of the time. My big accomplishments:
- deleted a lot of code by using with-accessors
- made all usage of x/y points go through 3 functions: make-point, x, and y, allowing for easily changing the internal representation of points in the future
- removed some slots from an object, replacing it with a few functions to calculate the desired value
- added a few more generic functions to support bar charts
- reduced the size of the legend
After working on the line chart code for awhile, adding bar charts was trivial: one class that extends line-chart, one macro to mirror with-line-chart, one method to draw bars instead of lines, and a couple of helper functions. I was really pleased with how easy it was to add the different graphing mode.
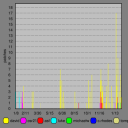
Of course, giving another dataset exposes more problems:
That’s for clbuild, and there are a few issues apparent here:
- when more than one bar is shown for one day, it draws them next to each other, which makes it hard to tell where on the bar is on the x-axis
- the legend wanders off the edge
- the month/day labels aren’t very descriptive
I think I’m going to solve the first two issues by allowing a summarize mode, where less significant series can be aggregated into a single “other” series. This is how I see a lot of other programs solve it, so I’ll give that a shot. I don’t think that will completely solve the first issue, but should alleviate it a little bit.
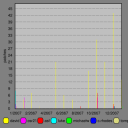
The last issue I solved by making a function to show patches by month instead of by day:
That shows the side-by-side bars problem pretty clearly, but what I find most interesting is the right side of the chart where we see more people starting to contribute. I think that’s indicative of the project gaining more users and activity.
Another interesting one, arnesi:
Early on, Marco Baringer was the driving force, but somewhere around the middle of 2006 I guess he had finished scratching all his itches, and Atilla Lendvai became the prime mover.
Alright, I could seriously speculate about these things all night, so I’m gonna stop now.
I still need to fix the above-mentioned bar chart issues, so there’s no new release of adw-charting, but all the code mentioned here is in the public darcs repository (http://common-lisp.net/project/adw-charting/darcs/) for the curious.
See the examples folder for the darc-changes graphing program, you need to get the xml from darcs using: darcs changes –xml.
