Skip to content

adw-charting is available for download

Someone on #lisp started talking about making line charts using vecto, so I went ahead and got setup a common-lisp.net project: http://common-lisp.net/project/adw-charting/

Now I’m somewhat flooded with digital paperwork:

  • Get my darcs repository onto common-lisp.net
  • Update the documentation to point to common-lisp.net (removed all the damn lies, so only vague untruths remain)
  • Get access to my trac sorted out (I sent an email to the cl.net admin)
  • Get my ssh keys sorted out
  • Get my setup at work pulling from the common-lisp.net darcs repo
  • Get my setup at home pulling from the common-lisp.net darcs repo
  • Make a script to generate docs/examples and transfer to common-lisp.net
  • Make a script to generate / sign a new release
  • figure out what I should be doing with mailing lists

I’ve never run an open source project before, I foresee a lot of learning in the coming weeks.

Paperwork aside, I did spend a lot of time last night on actual functionality. I spent a good bit of time reading through The Visual Display of Quantitative Information, to get a better sense of what goes into a good chart, and try to learn the right words for some of these things, and then worked on the code a bit:

  • converted macros to use &body instead of &rest, which gives Emacs some better ideas on how to indent code
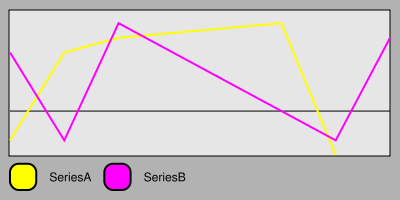
  • REVERSEd the list of data elements before display, so the legends on pie/line charts are ordered sensibly
  • Improved the example to not create duplicate X labels
  • Pulled apart a monolithic function into several smaller ones, introduced a class to help pass data between them
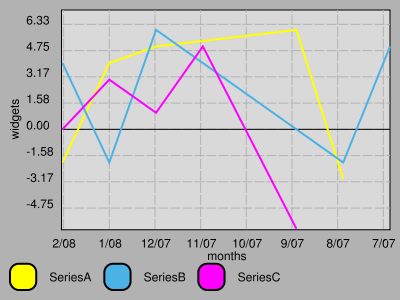
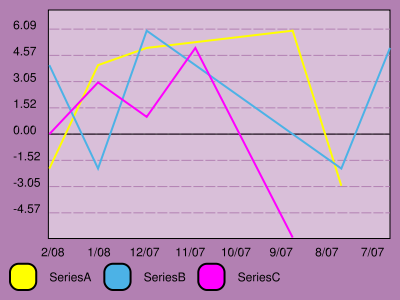
  • Tried to generate more human-friendly axis labels. Instead of splitting the y-axis into N even parts and drawing a label for whatever value happens to be there (which generates odd, unfriendly labels in the examples: 1.52, 3.05, 4.57), I look at the spread data, and pick a suitable interval. So, if the lowest y is -10 and the biggest is 2, then we have a total spread of 12, which is just over 10, so we should try to draw a label every 1.0 units. If the spread was 120, I’d try to draw a label every 10.0 units. I added some math to prevent overlapping labels, and then I have decent labels at human readable increments. There are still lots of problems with this scheme, so I haven’t pushed it yet. Hopefully I’ll have time tonight to work out some bugs, and add some more examples. This style of doing it would be a baby step towards another #lisp request, logarithmic axes.

I wasn’t very happy with using a helper class to pass state around, so I’ll probably try out a few different methods and see what works best.

experiments with clbuild, adw-charting progress

My new laptop came in on Thursday, a tiny asus eeepc.  The default OS is a customized Xandros, a debian spin-off, so it was pretty easy to add some apt sources and get all the tools needed to try out clbuild.  So far I’m very impressed, almost everything has just worked.

I installed darcs to download clbuild, and then it told me to install a few other tools: cvs, svn, and git.  I had one error later in the process, when git tried to use curl, but after installing curl things went pretty cleanly.

I was unable to build SBCL from source using clbuild, but I think that was a sourceforge problem, not a clbuild problem.  Every other installation went very smoothly.

I was particularly impressed by the ability to load emacs and slime.  I find setting up emacs to be the most laborious part of getting a lisp development environment going, and the “clbuild slime” command gets me halfway there.  Looking at the clbuild script, the way they do it is pretty simple, but its a nice time savings to not need to look that stuff up.

By automatically downloading a ton of code, clbuild also provided me with some nice reading, and I spent the evening hanging out with some neighbors and browsing source code, and saw some neat patterns.

When I got back home, I hacked a little on adw-charting,  changing awhen and aif usages to when-let and if-let calls, which is a macro I saw in several Edi Weitz packages.  when-let/if-let are a little longer than Marco Baringer’s awhen/aif, but I like the explicit names.  awhen/aif introduce meaningful names into the lexical environment, and that has always made me a little nervous.  Whenever names are introduced as side-effects I’m reminded of the mess that is ruby’s ActiveRecord, which has so much magical run-time craziness that your .rb file can seem totally unrelated to what actually gets executed.

I also got just about done on a nice documentation page for adw-charting, similar to Vecto’s.  So similar, one might think I copy/pasted the Vecto content and changed the relevant bits.  I ended up using this as an excuse to try out cl-who, which is a pretty nice library.  I found a bunch of adw-charting bugs in the process.  A few people have asked for source in blog comments, so my goal was to put out a 0.5 release today, but there are still some details to clear up:

  1. need to add some license crap to each source file (which might also be strangely similar to Vecto’s license crap)
  2. need to add readme / license files
  3. need to add some documentation about how adw-charting uses fonts
  4. need to sort out gpg signing / asdf-install chores
  5. possibly sort out apache incantations to allow read-only anonymous darcs access and submit a clbuild patch

I’ll try for Sunday.

Quicken 2007 fails

I use quicken to manage my finances, and find it overall does an excellent job, but every now and then it does something outrageous:

quicken-fails.png

Seriously?   You still can’t handle that?  I guess that means its time to take another stab at gnucash.

an x-axis plus API cleanup

Some more progress on the charting library today:

  • cleaned up the API a little bit, opting for some nicer make-foo function instead of requiring calls to make-instance:
    • make-series label data &key color
    • make-axis label &key control-string draw-gridlines-p label-formatter
      • control-string: a format-compatible control string, and supplying it sets the label-formatter for the axis
      • label-formatter: a function of 1 argument, returns a string used as an axis label
    • make-line-chart width height &key series y-axis x-axis background
  • The lightened portion of the graph is now the average of the background color and pure white
  • The labels on the axes are optional, and the graph adjusts to fill as big an area as possible
  • The distance between x-axis labes is calculated based on actual string-widths, so hopefully they will space themselves out reasonably under most conditions

Some examples:

This demonstrates using a control-string and a custom function for axis labels:

line-chart-with-axis-labels1.png

  (render-chart
   (make-line-chart 400 300
		    :background '(.7 .7 .7)
		    :series (list (make-series "SeriesA"
					       '((-1 -2) (0 4) (1 5) (4 6) (5 -3)))
				  (make-series "SeriesB"
					       '((-1 4) (0 -2) (1 6) (5 -2) (6 5))
					       :color '(.3 .7 .9))
				  (make-series "SeriesC"
					       '((-1 0) (0 3) (1 1) (2 5) (4 -6))))
		    :y-axis (make-axis "widgets"
				       :control-string "~$")
		    :x-axis (make-axis "time"
				       :label-formatter #'months-from-now->mm/yy))
   "line-chart-with-axis-labels.png")

This one changes the background color, removes the axis labels, and disabled grid lines for the x-axis:

line-chart-with-axis-labels2.png

(render-chart
   (make-line-chart 400 300
		    :background '(.7 .5 .7)
		    :series (list (make-series "SeriesA"
					       '((-1 -2) (0 4) (1 5) (4 6) (5 -3)))
				  (make-series "SeriesB"
					       '((-1 4) (0 -2) (1 6) (5 -2) (6 5))
					       :color '(.3 .7 .9))
				  (make-series "SeriesC"
					       '((-1 0) (0 3) (1 1) (2 5) (4 -6))))
		    :y-axis (make-axis nil
				       :control-string "~$")
		    :x-axis (make-axis nil
				       :draw-gridlines-p nil
				       :label-formatter #'months-from-now->mm/yy))
   "line-chart-with-axis-labels.png")

The internals are still messy, but I’ve gone through and was able to simplify some things here and there, here’s a few of the change’s I’ve made to make my code shorter and more readable:

  • replacing (destructuring-bind (x y) (foo) (bar x y) with (apply #’bar (foo))
  • adding a macrolet to concentrate some very similar behavior
  • using loop to count up and down at the same time (for drawing labels up/down the y axis and left/right on the x axis)
  • using (dolist (item lst) …) instead of (mapc #'(lambda(item) …) lst)
  • using loop‘s maximizing / minimizing features
  • using multiple-value-list and nth to get specific values from some function results without compiler warnings

I’ve been trying to put my tongue on why exactly I like lisp so much more than other languages, and working through this made it pretty clear: I have much better tools for reducing accidental complexity than in other languages, and can get the code focusing on what I’m trying to do, not how my compiler needs me to do it. The next time I get a free afternoon, I’m going to make an imperative API, similar to vecto’s:

(with-line-chart (400 300 :background '(.7 .7 .7))
    (add-series "SeriesA"
		'((-1 -2) (0 4) (1 5) (4 6) (5 -3)))
    (add-series "SeriesB"
		'((-1 4) (0 -2) (1 6) (5 -2) (6 5))
		:color '(.3 .7 .9))
    (add-series "SeriesC"
		'((-1 0) (0 3) (1 1) (2 5) (4 -6)))
    (set-axis :y "widgets" :control-string "~$")
    (set-axis :x "time" :label-formatter #'months-from-now->mm/yy)
    (save-file "line-chart-with-axis-labels.png")

That’s pretty damn readable.

updated: fixed syntax error in the imperative sample, and got the imperative bit actually working.

more graphing

Another productive afternoon:

line-chart-with-axis-labels.png

This is the start of axes. The internals are getting very, very messy, but I really like the result. Here’s the code used to create this:

(defun line-chart-with-axis-labels ()  
  "draws a simple line chart"
  (let* ((seriesA (make-instance 'series
				 :label "SeriesA"
					;data expressed as a list (x y) pairs
				 :data '((-1 -2) (0 4) (1 5) (4 6) (5 -3))))
	 (seriesB (make-instance 'series
				 :label "SeriesB"
				 :data '((-1 4) (0 -2) (1 6) (5 -2) (6 5))))
	 (y-axis (make-instance 'axis
				:label "widgets"
				:label-formatter #'(lambda (x-val)
						     (format nil "~$" x-val))))
	 (chart (make-instance 'line-chart
			       :width 400
			       :height 300
			       :background '(.7 .7 .7)
			       :series (list seriesA seriesB)
			       :y-axis y-axis)))
    (render-chart chart "line-chart-with-axis-labels.png")))

I predict adding X axes will be very similar to adding the Y axis, and then I’ll be looking more seriously at spending time to make good docs and releasing this back to the community. The API is getting a little dense, too, but that should be pretty easy to simplify, and I have a few ideas on how to do that.

charting library taking form

It now does line charts and better pie charts, and has had a lot of bugs removed since the last post. We did some code review on it at work, brought some of the spaghetti under control, and included the library in an intranet app.

Here’s a sample line graph:

line-chart-sample.png

The (somewhat verbose) code for this:

(defun line-chart-sample ()  
  "draws a simple line chart"
  (let* ((seriesA (make-instance 'series
				 :label "SeriesA"
					;data expressed as a list (x y) pairs
				 :data '((-1 -2) (0 4) (1 5) (4 6) (5 -3))))
	 (seriesB (make-instance 'series
				 :label "SeriesB"
				 :data '((-1 4) (0 -2) (1 6) (5 -2) (6 5))))
	 (chart (make-instance 'line-chart
			       :width 400
			       :background '(.7 .7 .7)
			       :series (list seriesA seriesB))))
    (render-chart chart "line-chart-sample.png")))

I’ll probably make some easier syntax for creating series, similar to the one I made for pie slices, but for now the CLOS approach has been working decently. My data is coming from clsql, so the code ends up more concise than this example.

There are a few spots internally where it gets a little nasty, needing to pass many things around to many functions. I may end up changing the style to use “with-line-chart” functions with some global variables tracking the current chart, but I’m not sure how that would work in a multi-threaded environment. Hell, I’m not sure if my existing code will work in a multi-threaded environment. The load on this intranet app is very low, so I may be lucky enough to get away with it.

Working with the lisp community on IRC

I’ve seen a lot of complaints about the lisp community being arrogant bastards who are too busy being smarter than you to help. Over the past few months, I’ve been observing behavior, lurking in #lisp, and I think I’ve figured out the source of confusion. The lisp community behaves differently than many other communities, and many lisp newbies have no way to know that.

Based on the many blog posts and articles extolling lisp, as a newcomer I expected the room to have:

  • jubilant evangelists hopping at the opportunity to make another convert
  • experts offering silver-bullet solutions to every problem
  • rapid-fire discussion on how to solve hard problems (with silver-bullet solutions)

Obviously, I was wrong.

  • There are no evangelists on call to help new lisp users. Some people have the channel open, and will offer advice, but there’s no one chomping at the bit.
  • experts will offer solutions to problems, if you ask an intelligent question
  • occasional rapid-fire discussion about hard problems that are WAAAY over my head
  • occasional discussion about simpler problems
  • lots of redirecting to web pages with information

I think the hype around languages has been taken up a notch since ruby and rails hit the scene (my brother and I would joke about the hyperbole by trading suggestions over IM like “why don’t you just $gem install my_internal_webapps”). Language mavens get practically orgasmic in their praise, so much as to spawn a mock blog: Lisp at Light Speed. That thing makes me laugh every time I read it. I’m noticing a trend: the real core members of a community are too busy working to blog, and most evangelists don’t have a lot of knowledge, they just feel really good about what they’ve done so far.

I’ve asked easy / stupid questions in #lisp without any noticeable backlash by treating it as if I were a 6th grader in the university library, surrounded by Ph.D students who are all working quietly on their own theses. This is how I handle any knowledgeable group that I’m trying to get help from. I check every reference manual I can find first (clhs, practical common lisp, google), if I have code I first copy/paste it into pastebin, then include that link along with a lengthy, detailed question. I re-read my question a few times, thinking if I could phrase it any better, then submit. For now, all my questions have been basic enough that someone will link me to the relevant resource or give a terse answer almost immediately.

I have seen some people ask questions without much forethought, and get criticized bluntly, which too frequently gets interpreted as harshly. I saw someone post some code, claiming to have solved some problem for the community, and the terse response was something like “that code is not very good”. It’s the truth, but that’s gotta sting. I tried to soften it by eliciting some specific recommendations for the newcomer, but I think that person will simply walk away thinking #lisp is full of assholes.

In my mental image, that sixth grader just walked up to the Ph.Ds with some chicken scratch on notebook paper and said “Hey, I did this for you”. The Ph.Ds, being engrossed in their work, look up and immediately think “there’s no way I could ever use that”. Being used to talking to other Ph.Ds, they dismiss the kid’s paper, trying not to be mean about it, and then go back to work.

It seems to me that much of the negative impression around the lisp community arises from sky-high expectations and bad question asking procedures.

A good day’s hacking

Everyone had the day off, so I decided to work on making a graphing library. I’ve been on a fairly constant quest for easy data visualization, running through several options:

  1. homegrown SVG renderer (javascript)
  2. homegrown png renderer (C#)
  3. Gruff (ruby)
  4. some graphing capability from Dojo (javascript)
  5. cl-plplot

I’ve never been happy with any of these, for a few reasons:

  1. SVG support for IE is a pain
  2. C# requires a million objects to do anything
  3. Gruff had good defaults, but had some annoying bugs, and I ended up jumping through a lot of hoops to get some basic aggregation going.  I looked at monkey-patching gruff, but that seemed like a really bad idea
  4. The dojo charting was slow, and the setup was verbose (this may have changed)
  5. cl-plplot output wasn’t very attractive. Great for scientific usages, but for business apps it didn’t have enough rounded edges.

I want something that’s concise, has good defaults, rendered to PNG, and is easy to use from lisp. So today I tried rolling my own, and I’m pretty happy with the results:

pie-chart-sample.png

The code to generate this graph is pretty concise, too:

(defun pie-chart-sample ()
  "draws a simple pie chart, rending to pie-chart-sample.png"
  (render-chart
   (make-instance 'pie-chart
		  :data-items (make-items '(40
					    (10 "baz")
					    (60 "bar" (.5 .5 .5)))))
   "pie-chart-sample.png"))

This demonstrates a few things:

  1. data can be specified as value, a value/label, or value/label/color
  2. it automatically choses colors if unspecified
  3. the labels are automatically positioned off to the side

There’s still some places to cleanup the API, I don’t like having make-items in there, and a lot of the behind the scenes is messy as all hell.

I started by looking at the source for Paragent, a lisp-based IT management tool. I first saw really attractive graphs coming from lisp there, and it impressed me a lot. It was building on cl-vectors, salza, and zpb-ttf to make png files. There was a lot of weird stuff going on in the paragent code, so I instead opted to port my old javascript code to lisp, using vecto for the rendering.

I ran into a brick wall pretty early when calculating the wedges, as I’ve forgotten just about all the math I ever knew (had to look up the distance formula, for christsakes). The main problem was figuring out how to draw the curved part. I spent a long time staring at Bézier curves before giving up and taking a different approach. I made a circular clip-path (basically a mask) for the chart, and drew big enough wedges to fill the circle, side-stepping my mathematical shortcomings. There’s some goofy code to account for large slices, but it worked for all values I tested.

I did a LOT of learning on this one, working through some package semantics and adding some sparse lisp-unit tests. A few more days worth of effort for other chart types, and I might have something worthy of release.

String building in Lisp

We’re grinding (in the RPG sense) with lisp at work, and keep coming into problems that have multiple simple solutions, but don’t have the instincts/knowledge to readily identify which one is best. One such problem is building up strings, in a couple of cases. I took some time this morning to go through the cases, using a 10000 iteration loop and time to do a simple benchmark. The tests were run on SBCL 1.0.11.

UPDATE: added metrics with *PRINT-PRETTY* off, as suggested in comments. This has a big effect.

Conversion

There are some cases where we wanted a number as a string, as part of building HTML. For this demo, we’ll put the number in variable *d*:

(defvar *d* 19.80)

We found three options:

  1. cl-interpol: #?”${*d*}” => “19.8”
  2. (princ-to-string *d*) => “19.8”
  3. (format nil “~a” *d*) => “19.8”

Here’s how they compared:

method bytes consed. page faults calls to %EVAL system run time (s) user run time (s) real time (s)
cl-interpol, *PRINT-PRETTY* nil 5,677,440 0 0 0.0 0.085987 0.087
cl-interpol 22,964,840 0 0 0.001 0.138979 0.137
princ-to-string, *PRINT-PRETTY* nil 0 0 0 0.0 0.0 0.0
princ-to-string 0 0 0 0.0 0.0 0.0
format, *PRINT-PRETTY* nil 6,483,008 0 0 0.0 0.110984 0.111
format 23,763,096 0 0 9.99e-4 0.166974 0.168

Princ-to-string is the bigger winner in this case.

Simple Prepending

For the this case, we have some decimal value in a variable called *d*, and want it in a string, prepended with a “$”.

We identified three possible solutions:

  1. (arnesi:join-strings (list “$” (princ-to-string *d*))) => “$19.8”
  2. cl-interpol: #?”$${*d*}” => “$19.8”
  3. (format nil “$~a” *d*) => “$19.8”

Here’s how they compared:

method bytes consed. page faults calls to %EVAL system run time (s) user run time (s) real time (s)
arnesi:join-strings, *PRINT-PRETTY* nil 6,320,064 0 0 9.99e-4 0.099985 0.1
arnesi:join-strings 23,598,928 0 0 0.002 0.158975 0.159
cl-interpol, *PRINT-PRETTY* nil 5,675,904 0 0 0.0 0.078988 0.079
cl-interpol 22,961,800 0 0 0.001 0.144978 0.144
format, *PRINT-PRETTY* nil 6,801,568 0 0 0.0 0.122982 0.122
format 24,085,088 0 0 0.0 0.186971 0.186

In this case, cl-interpol wins on all counts, after compile time.

Dynamic Prepending

In this case, our prefix is determined by another variable:

(defvar *prefix* "$")

  1. (arnesi:join-strings (list *prefix* (princ-to-string *d*))) => “$19.8”
  2. cl-interpol: #?”${*prefix*}${*d*}” => “$19.8”
  3. (format nil “~a~a” *prefix* *d*) => “$19.8”
method bytes consed. page faults calls to %EVAL system run time (s) user run time (s) real time (s)
arnesi:join-strings, *PRINT-PRETTY* nil 6,319,784 0 0 0.0 0.099985 0.101
arnesi:join-strings 23,602,432 0 0 0.001 0.155977 0.156
cl-interpol, *PRINT-PRETTY* nil 5,679,672 0 0 0.0 0.081987 0.083
cl-interpol 40,239,976 0 0 0.0 0.19597 0.196
format, *PRINT-PRETTY* nil 7,282,504 0 0 0.002 0.13298 0.131
format 41,845,632 0 0 0.001 0.234964 0.234

Now things get a little messier, and dependent on the setting of *PRINT-PRETTY*. join-strings wins big if *PRINT-PRETTY is on, but if its off, then cl-interpol takes the cake again.

Simple Wrapping

In this case we want to put some text before and after our value.

The options:

  1. (arnesi:join-strings (list “$” (princ-to-string *d*) ” USD”)) => “$19.8 USD”
  2. cl-interpol: #?”$${*d*} USD” => “$19.8 USD”
  3. (format nil “$~a USD” *d*) => “$19.8 USD”

The data:

method bytes consed. page faults calls to %EVAL system run time (s) user run time (s) real time (s)
arnesi:join-strings, *PRINT-PRETTY* nil 6,722,200 0 0 0.0 0.095985 0.096
arnesi:join-strings 24,001,352 0 0 0.001 0.165975 0.163
cl-interpol, *PRINT-PRETTY* nil 5,845,912 0 0 0.0 0.093986 0.094
cl-interpol 23,122,736 0 0 0.001 0.147977 0.149
format, *PRINT-PRETTY* nil 7,439,600 0 0 0.0 0.13298 0.132
format 24,725,176 0 0 0.001 0.19897 0.199

cl-interpol is still the winner, which is expected given the results of the simple prepending.

Dynamic Wrapping

Now let’s put the suffix into a variable and see how it goes:

(defvar *suffix* "USD")

The options:

  1. (arnesi:join-strings (list *prefix* (princ-to-string *d*) ” ” *suffix*)) => “$19.8 USD”
  2. cl-interpol: #?”${*prefix*}${*d*} ${*suffix*}” => “$19.8 USD”
  3. (format nil “~a~a ~a” *prefix* *d* *suffix*)=> “$19.8 USD”

The results:

method bytes consed. page faults calls to %EVAL system run time (s) user run time (s) real time (s)
arnesi:join-strings, *PRINT-PRETTY* nil 6,964,576 0 0 0.0 0.100985 0.101
arnesi:join-strings 24,248,160 0 0 0.001999 0.166975 0.168
cl-interpol, *PRINT-PRETTY* nil 5,842,032 0 0 0.0 0.099985 0.099
cl-interpol 57,682,928 0 0 0.001 0.250961 0.251
format, *PRINT-PRETTY* nil 8,560,800 0 0 0.0 0.155977 0.157
format 60,406,968 0 0 0.001 0.341948 0.342

Another mixed result, depending on *PRINT-PRETTY*. Again we have join-strings if you need *PRINT-PRETTY*, cl-interpol if not.

My Conclusions

Use princ-to-string for simple conversions, use cl-interpol everywhere if you can turn off *PRINT-PRETTY*. If I need *PRINT-PRETTY*, then use cl-interpol and replace it with join-strings when tuning performance.

“manual or distributed transaction mode”, ruby, rails, mssql, ado

Spent too much damn time debugging the database layer in rails again today. This was the error:

OLE error code:80004005 in Microsoft OLE DB Provider for SQL Server
Cannot create new connection because in manual or distributed transaction mode.

This was getting thrown after an insert, and the problem was very non-obvious.  I found one potential solution on Occasionally Useful Software‘s post about Ruby and SQL Server, but that seemed a little heavy-handed.

Somewhere in the bowels of ActiveRecord, dbi.rb, ADO.rb, and the SQLNCLI driver, something expected one result-set per SQL command. My insert was firing a database trigger, and so the ruby stack saw two result-sets, one saying “1 row affected” for the original insert, one saying “0 rows affected” for the trigger. I’m still a little confused, as I thought those “rows affected” messages were separate from proper result-sets (the results from a SELECT, for example), but apparently those little buggers count enough.

Adding a “SET NOCOUNT ON” to the top of the trigger fixed it.