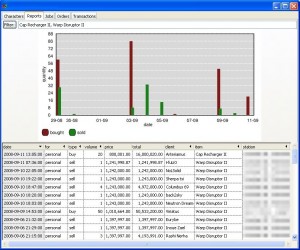
I’ve recently come to an obvious conclusion: chart layout is really hard, and not in a fun way.
Luckily, Google has clarified the terms of use on their charting service, which is a RESTful API that returns png files based on some arc-ish querystring parameters. No google API key is required, the 300,000 pixel image size limit is reasonable, and they request to be notified if you need to make more than 250,000 charts in one day.
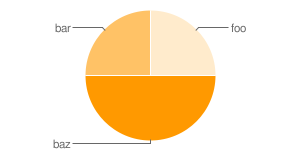
This afternoon I spent some a little time with DRAKMA, and ported my pie chart feature. I challenge you to guess which went through my layout code, and which came through google:


Give up? Me too.
Here are the two functions used to generate those charts:
(defun pie-gchart ()
  (with-gchart (:pie 300 150)
    (add-slice "foo" 10d0)
    (add-slice "bar" 10d0)
    (add-slice "baz" 20d0)
    (save-file "pie-gchart.png")))

(defun pie-chart ()
  (with-pie-chart (300 150)
    (add-slice "foo" 10d0)
    (add-slice "bar" 10d0)
    (add-slice "baz" 20d0)
    (save-file "pie-chart.png")))
I was able to use generic methods to reuse all my existing code, but instead of performing VECTO operations, it builds up the proper parameter list and performs one http call.
I plan to make all of ADW-CHARTING use google to do the hard work. I’ve got some code in the darcs repo, and after I get my other chart types ported over I’ll update the website, examples, docs, etc.
I did decide to change my API approach for the google charts, making one with-gchart that takes the chart type as an argument, instead of have a with-pie-gchart, with-line-gchart, etc.
I was a little concerned about adding the dependency on google, but all of my usages so far are either for web apps that are already connected, or for generating static html, in which I’d be saving the chart locally anyway.
Some day I might revisit the chart layout problem, but for now the parameter building problem is a lot less daunting, and the API design problem is a lot more interesting. There are tons of options for google charts, and making lispy ways to specify all that should be fun.


