Skip to content

Practical Lisp 2008

Zach Beane asked what people are working on, here’s my contribution:

Work:

  • Web application managing all data for my employer, Acceleration.net
    • Replaces an old C++ desktop app and an old ASP web app
    • Tracks LOTS of random customer data
    • Generates CSV exports for bulk credit card charging
    • Uses CLSQL and a byzantine set of libraries to use the legacy SQL Server 2000 database as the data store, allowing parallel operation with the old C++. I think this might make us the only outfit in the world using the Linux /Apache / SQL Server / Lisp stack.
    • Uses a modified UCW as a web framework, running in httpd mode behind Apache, which handles the LDAP authentication and SSL
    • Uses ADW-CHARTING for some data display
    • Uses CL-PDF and CL-TYPESETTING to generate PDF invoices, which are printed and mailed (soon to be emailed)
    • Uses many more helper libraries: CL-PPCRE, ARNESI, METABANG-BIND, CXML, PARENSCRIPT
  • Code-generation for administrative web interfaces for one client (I haven’t asked for permission to disclose this, so I’m not going to mention who)
    • Builds XML files containing XUL and javascript, which get used as the front-end in an ASP.NET website
    • Uses several helper libraries: CL-PPCRE, CXML, PARENSCRIPT
  • Some upcoming projects
    • various websites for profiling carbon emissions (will link when there’s anything up)
    • plan to use Postgresql with POSTMODERN, possible CL-PEREC or ELEPHANT

Personal:

  • Charting random data using ADW-CHARTING, my pet graphing library
  • Some experiments with chat-bots and google calendar integration to get IM updates for events. I failed at this early last year when CL-XMPP didn’t work and I didn’t know enough to read it, let alone fix it. I think cl-xmpp has seen some loving in the last year, so I might give this another shot.

brief list of things that make working in C# frustrating

Problem: .NET framework classes don’t use interfaces enough

Specific example: DataSource / DataBind()are separately defined on Repeater and GridView, (and Control, and many, many others), and my abstract base class doesn’t care which option an implementor chooses, it just wants to bind the data however the base control wants it.

Possible Solutions:

  • Define interface IDataBinding, class MyRepeater : Repeater, IDataBinding, class MyGridView : GridView, IDataBinding, etc.
  • Define interface IDataBinding, upgrade to C# 3, use extension methods to add IDataBinding nope, extension methods can’t do this
  • Copy/paste identical code from my base class into concrete classes
  • Use reflection to set DataSource and call DataBind(), completely sidestepping the C# type system

Problem: .NET framework classes not designed for extension: “cannot override inherited member 'System.Collections.Generic.Dictionary<X, Y>.Add(X, Y)' because it is not marked virtual, abstract, or override

Specific Example: Extending System.Collections.Generic.Dictionary to do some permit a list of values for one key, so adding the first item is stored as a single value, but adding a second value to the same key stores both values in a list. Error message is: “cannot override inherited member 'System.Collections.Generic.Dictionary<X, Y>.Add(X, Y)' because it is not marked virtual, abstract, or override

Possible Solutions:

  • Define wrapper classes that encapsulates the framework class and implements all the base interfaces, with the vast majority of the code being straight delegation to the framework class:
    class MyDict : IDictionary, [other interfaces...] {
    private Dictionary<X,Y> dict = new Dictionary<X,Y>;
    public bool Contains(X key){ return dict.Contains(key);}
    [... other simple wrappers...]
    }
  • Find a less appropriate framework class that is designed for extension, duplicate behavior of the proper framework class manually, eg: add run-time type checks for Hashtable.Add(object, object) in place of the letting the compiler handle the types as in Dictionary<X,Y>.Add(X, Y)
  • Extend Dictionary<X,Y>, define a method AddList(X,Y), and avoid using IDictionary in the rest of my code
  • Upgrade the C# 3, use extension to add function AddList to IDictionary, be sure to include those extensions on every consumer of IDictionary

Problem: .NET framwork classes not designed for extension: members declared private/ internal / protected internal

Specific Example: Storing additional data in ViewState on 2 different controls that have different base classes. One is a user control, another extends RadioButtonList to provide different UI for the same data

Possible solutions:

  • Upgrade to C# 3, use extension methods to add functions nope, extension methods can only see public members, ViewState is protected
  • Use reflection to set ViewState
  • Copy/paste code into each control
  • Define interface IPublicViewstate, class MyRadioButtonList : RadioButtonList, IPublicViewState, class MyUserControl : UserControl, IPublicViewState, etc

As Nathan said, I’m stuck between a rock and IHardPlace.

adw-charting darcs repository moving

I apparently can’t follow instructions, and put my darcs repo in the wrong place on common-lisp.net, polluting their darcsweb. The new location is:

http://common-lisp.net/project/adw-charting/darcs/adw-charting

I’ll be deleting the old junk in a few days.

the beginnings of bar charts

Spent a ton of time today playing with adw-charting. I wanted to expand on the source contributor graphs from the other day, and ended up implementing some basic bar chart functionality.

I’ve read a lot of complaints about the lack of lisp libraries, so whenever I sit down to do some random task, I try to use libraries as much as I can to test the validity of those complaints. I also learn a lot by reading and experimenting with other people’s code, and slowly I can see my style getting more lispish, and less C#-ish. clbuild makes it trivial to get many libraries usable, and today I had good luck with everything just working.

I used darcs as my source of dataset, its xml changes output has a simply formatted time string. I told clbuild to install closure xml (cxml), and in fairly short order I had a 80 line program that:

  1. uses the cxml klacks system to pull the information I wanted out of the file in one pass
  2. uses cl-ppcre to parse the username out of the darcs author string, so authors “Ryan Davis <ryan@acc…” and “ryan@acce…” both get displayed as “ryan”.
  3. uses adw-charting to chart patches per day into a png

The result was less than spectacular:
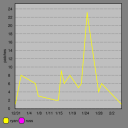
darcs.png

The chart looks pretty nice, but its lying horribly. My data set didn’t have explicit zeros for days without activity, so the line goes from one active day to another, telling all kinds of lies. My favorite is the 2.5 patches it says I pushed on 1/11. The other fun one is that Russ shows up in the legend, but his one patch isn’t visible at all, because there was only one data point, and you need two points to make a line.

What is really appropriate here is a bar chart. Adding explicit zeros is a waste of time and RAM (among other things), so I opted for making a bar chart type. After many more hours of coding, I changed with-line-chart to with-bar-chart and re-ran my program:
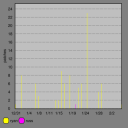
darcs1.png

Much better. There’s a few rendering problems, but the data is shown alright.

Adding support for bar charts was actually really easy, it was going back and reworking my amatuerish code that took most of the time. My big accomplishments:

  • deleted a lot of code by using with-accessors
  • made all usage of x/y points go through 3 functions: make-point, x, and y, allowing for easily changing the internal representation of points in the future
  • removed some slots from an object, replacing it with a few functions to calculate the desired value
  • added a few more generic functions to support bar charts
  • reduced the size of the legend

After working on the line chart code for awhile, adding bar charts was trivial: one class that extends line-chart, one macro to mirror with-line-chart, one method to draw bars instead of lines, and a couple of helper functions. I was really pleased with how easy it was to add the different graphing mode.

Of course, giving another dataset exposes more problems:
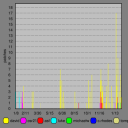
darcs2.png

That’s for clbuild, and there are a few issues apparent here:

  • when more than one bar is shown for one day, it draws them next to each other, which makes it hard to tell where on the bar is on the x-axis
  • the legend wanders off the edge
  • the month/day labels aren’t very descriptive

I think I’m going to solve the first two issues by allowing a summarize mode, where less significant series can be aggregated into a single “other” series. This is how I see a lot of other programs solve it, so I’ll give that a shot. I don’t think that will completely solve the first issue, but should alleviate it a little bit.

The last issue I solved by making a function to show patches by month instead of by day:
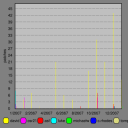
darcs3.png

That shows the side-by-side bars problem pretty clearly, but what I find most interesting is the right side of the chart where we see more people starting to contribute. I think that’s indicative of the project gaining more users and activity.

Another interesting one, arnesi:
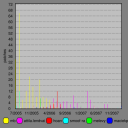
darcs4.png

Early on, Marco Baringer was the driving force, but somewhere around the middle of 2006 I guess he had finished scratching all his itches, and Atilla Lendvai became the prime mover.

Alright, I could seriously speculate about these things all night, so I’m gonna stop now.

I still need to fix the above-mentioned bar chart issues, so there’s no new release of adw-charting, but all the code mentioned here is in the public darcs repository (http://common-lisp.net/project/adw-charting/darcs/) for the curious.

See the examples folder for the darc-changes graphing program, you need to get the xml from darcs using: darcs changes –xml.

clbuild on my eeepc

Today and yesterday I got my eeepc setup for lisp development, using clbuild to get all the dependencies resolved for me. After some trial and error, here were my steps:

  1. Added xandros repositories and updates.xepc.org repositories to /etc/apt/sources.list, set updates.xepc.org to have the same priority as the asus repository in /etc/apt/preferences
  2. The version of git in those repos is too old, so also add backports.org to sources.list:
    deb http://www.backports.org/debian etch-backports main contrib non-free, then pin git-core in /etc/apt/preferences:

    Package: git-core
    
    Pin: release a=etch-backports
    
    Pin-Priority: 999
  3. Install tools clbuild needs: sudo apt-get install darcs cvs subversion curl cogito git-core sbcl
  4. Install clbuild: darcs get http://common-lisp.net/project/clbuild/clbuild
  5. Make the script executable: chmod u+x clbuild/clbuild
  6. Get a recent version of sbcl: ./clbuild/clbuild buildsbcl
  7. Watch sbcl compiler output, speculate on what things like “(DEFINE-SOURCE-TRANSFORM LOGNOR ...)” might mean
  8. Give up on waiting for the sbcl to finish compiling, spend 6 hours at Nathan’s house for dinner, beer, and Rock Band.
  9. Get some basic libraries: ./clbuild/clbuild update --main-projects
  10. Compile slime: ./clbuild/clbuild build slime
  11. Load up emacs and slime to verify everything went smoothly: ./clbuild/clbuild slime

UPDATE: added bits about getting  a recent version of git installed, clbuild needs it for updating source directories after initial installation.  My repos installed 1.4.x, and that doesn’t seem to include git-config, nor set the remote.origin.url config value which clbuild depends on.  Once I got git 1.5.x, I downloaded the projects again, and now everything works fine. That took me approximately forever to figure out.

compiling emacs22 on my eeepc

Tonight I took some time and compiled emacs22 for my eeepc.  After a little trial and error, here were my steps:

  1. Download emacs
  2. Add non-asus package repositories
  3. sudo apt-get install build-essential
  4. sudo apt-get install libncurses5-dev
  5. sudo apt-get install xlibs-dev (if you want to emacs to use X)
  6. unpack emacs tarball
  7. ./configure
  8. make (took about 6 minutes)
  9. sudo make-install
  10. go to sleep

sbcl contributors over time

I took a break from the day-to-day work (maybe giving Visual Studio’s a timeout will solve it’s “Generation of designer file failed: Unknown server tag…” problem), and noticed jsnell posted a list of SBCL contributors to #lisp, and decided to do some graphing:

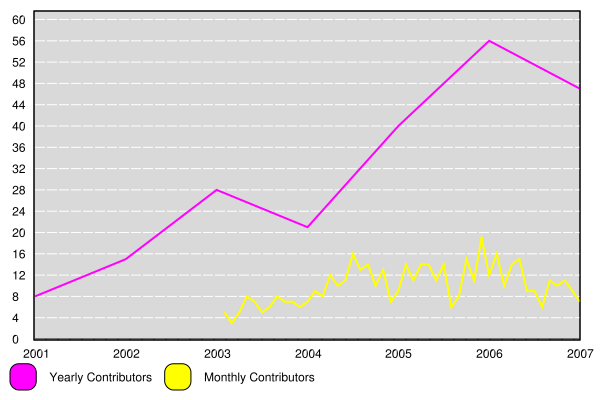
yearly1.png

Of course, since I’ve never graphed this before, I found 2 bugs. I copied the text from jsnell paste and used cl-ppcre to split it up into data sets. I had to do a little math to get the months to line up nicely with the yearly sums, but it was all pretty straightforward.

Code, excluding the copied text from lisppaste:

(defun make-months ()
  (loop for month in '("Jan" "Feb" "Mar" "Apr" "May" "Jun"
		       "Jul" "Aug" "Sep" "Oct" "Nov" "Dec")
	counting T into val
	collect (list month (float (/ val 12)))))

(defun yearly-data ()
  (let (result)
	(cl-ppcre:do-register-groups (year contribs)
	    ("(\\d+):(\\d+)" +yearly-raw-data+)
	  ;;add 1 so the yearly totals line up with
	  ;;december monthly data
	  (push (list (+ 1 (parse-integer year))
		      (parse-integer contribs))
		result))
	result))

(defun monthly-data ()
  (let ((months (make-months))
	result)
	(cl-ppcre:do-register-groups (year monthname contribs)
	    ("(\\d+)-(\\w{3}):(\\d+)" +monthly-raw-data+)
	  (push (list
		 (+ (parse-integer year)
		    (second
		     (assoc monthname months
			    :test #'string=)))
		 (parse-integer contribs))
		result))
	result))

(defun yearly-graph ()
  (with-line-chart (600 400)
    (add-series "Yearly Contributors" (yearly-data))
    (add-series "Monthly Contributors" (monthly-data))
    ;;so the yearly totals line up, the data is offset by 1
    (set-axis :x nil :draw-gridlines-p nil :data-interval 1
	      :label-formatter #'(lambda (y)
				   (princ-to-string (1- y))))
    (set-axis :y nil)
    (save-file "yearly.png")))

more adw-charting paperwork complete

Made another release tonight, but there are no new features, this is just tying up some loose ends:

  • added a LICENSE file and license headers in each file.
  • removed cl-vector-chart.lisp, which I had looked at for inspiration, but ultimately decided not to use.
  • added a lisp file and shell script to automate making a release.

Thanks to Nikodemus Siivola for taking a look at the code and making some suggestions.

I’m still pretty new to the culture of open source, and it always amazes me when people spontaneously offer advice and help.  This sort of behavior helps restore my faith in humanity, which my national government seems to sap at every opportunity.  It’s very nice to see some upward spirals.

I’m also greatly amused by the stark contrast between the awesome lisp community that’s taking time to help me and the elitist-asshole lisp community I’ve read about off reddit.

Next time: some graphs to map performance differences as I evolve the adw-charting internals, and more Lisp.

SQL Server 2005 doesn’t like bitwise comparison of large numbers

An update trigger using COLUMNS_UPDATED() was failing, and I figured out the problem:

Some simple SQL:

SELECT CAST(0x0200 as bigint), 0x0200 | 0
SELECT CAST(0x02000 as bigint), 0x02000 | 0
SELECT CAST(0x020000 as bigint), 0x020000 | 0
SELECT CAST(0x0200000 as bigint), 0x0200000 | 0
SELECT CAST(0x02000000 as bigint), 0x02000000 | 0
SELECT CAST(0x020000000 as bigint), 0x020000000 | 0
SELECT CAST(0x0200000000 as bigint), 0x0200000000 | 0
I had “IF COLUMNS_UPDATED() | 0 > 0” in my trigger, and on large values of COLUMNS_UPDATED(), bitwise ORing with zero equals zero.  Of course, “IF COLUMNS_UPDATED() | 0 > 0” is a retarded way to say “IF COLUMNS_UPDATED() > 0”, but whatever codepath that large number triggers wigs out there to.  Try these out:

SELECT 1 WHERE 0x0200000000 > 0
SELECT 1 WHERE CAST(0x0200000000 as bigint) > 0

So, to fix my trigger, I have “IF CAST(COLUMNS_UPDATED() as bigint) > 0”, which still seems a little retarded, but at least my trigger works.

adw-charting 0.7

I finally got some time to employ the adw-charting library in my intranet app, and the increase in data sets revealed a lot of bugs.  Tonight I finally put together a release.

Some changes:

  • Pie chart slices are made much more intelligently, resolving some bad rendering with some datasets.
  • x-axis label locations are decided in a much more sane manner, and was reworked sans scotch.
  • if the x-axis label intervals are not sane, then you can specify what the interval should be with the new set-axis keyword argument, :data-interval.
  • the docs are updated to mention :data-interval and show an example usage.
  • Fixed a bug reported by Stuart Mackey with minimum x-values above 0.

So now I’m getting into several new territories:

  1. running an open source project
  2. coding lisp for performance

The first is pretty fun, really, everyone I’ve interacted with has been very helpful and reasonable.  There’s been a flurry of activity around lisp charting libraries, so I feel some sense of competition, but the big difference is I can incorporate someone else’s code to make my library better, which is pretty cool.  I’ve heard claims that open source is a way applying the scientific method to software, and (given the right licenses) that’s not too far off.  My next goal is to cannibalize cl-pdf‘s charting.  They have some niceness there that I might be able to toss in front of vecto and get a lot of nice features pretty quickly.

The second is a quite a bit more daunting.  Currently I cons an absurd amount to generate the example graphs (around 70MB for one graph), and I’d like to get that down a bit.  I’m going to setup some benchmarks and track some data on time spent and bytes consed, so I can tell if what I change is helpful.  I’ve been reading up on vectors and arrays, and will try to use those instead of lists where it seems easy.    The other thing I was thinking of was putting in some type declarations as a sacrifice to the compiler gods.